Tech Stack Detection and Security Misconfiguration: How Exposed Technologies Expand Your Attack Surface
A security consultant runs a single command against your domain. Within seconds, they know your web server is running nginx 1.22, your CMS is WordPress 6.4.2, your frontend uses React 18 with Next.js, your login page runs on a subdomain powered by an outdated version of Keycloak, and your HR department published a benefits guide last quarter using Microsoft Word 2019 — authored by your Head of People Operations.
None of this required any exploitation. No credentials were stolen. No vulnerability was triggered. Everything was freely available — leaked through HTTP headers, HTML source code, URL patterns, file metadata, and subdomain configurations that no one thought to lock down.
Now imagine an attacker running the same command. They take those software versions, cross-reference them against the CVE database, find three known vulnerabilities with high EPSS scores (meaning they are actively being exploited in the wild), and craft a targeted attack against the specific version of Keycloak running on your login subdomain. Time from first scan to initial exploit: under fifteen minutes.
This is not a sophisticated attack. It is the direct consequence of security misconfiguration — one of the most persistent and preventable categories in the OWASP Top 10. And it begins with something most organizations overlook entirely: tech stack detection.
This guide covers how attackers fingerprint your technology stack from subdomains and files, why exposed technologies dramatically expand your attack surface, how to detect what you are leaking, and what to do about it — before someone else does it for you.
What Is Tech Stack Detection and Why It Matters
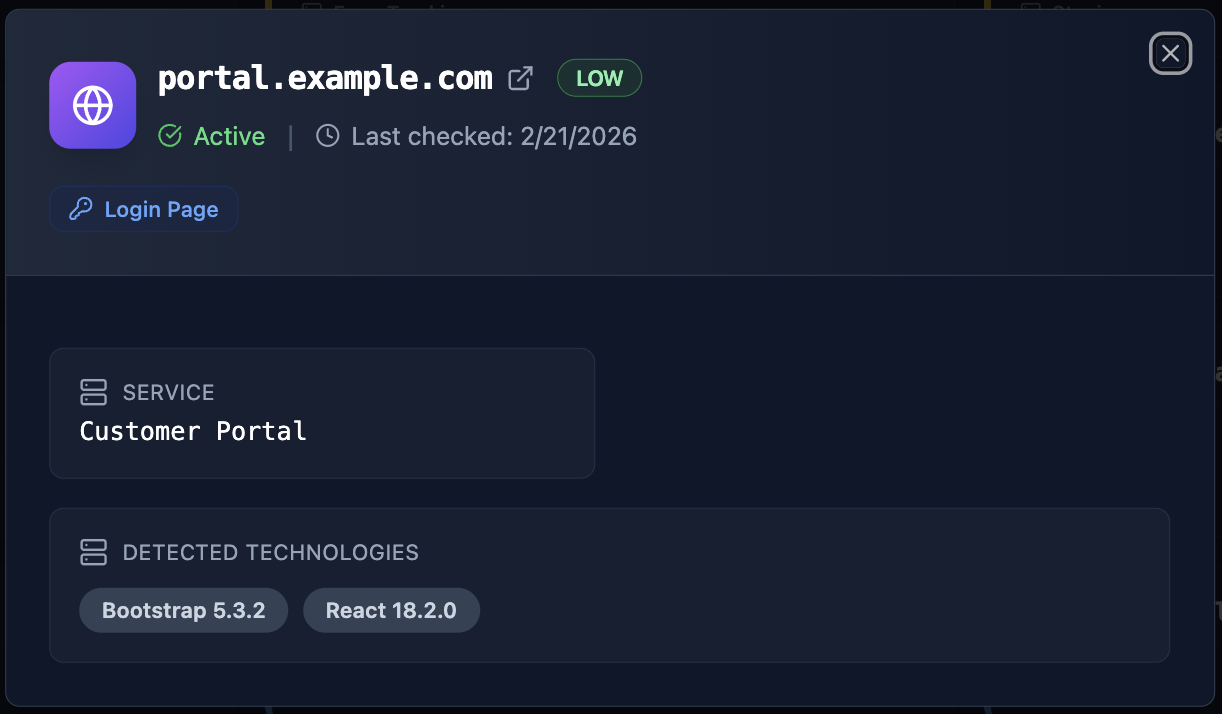
Tech stack detection — also called technology fingerprinting or technology profiling — is the process of identifying the specific software, frameworks, libraries, and versions that an organization uses across its web infrastructure. This includes everything from the web server and CMS to the JavaScript framework rendering the frontend, the authentication platform behind the login page, and the software that created a PDF hosted on the marketing site.
From an attacker’s perspective, tech stack detection is the foundation of target reconnaissance. Knowing that a target runs WordPress 6.4.2 is not just a trivia fact — it is a key that unlocks a specific list of known vulnerabilities, default configurations, and common misconfigurations. The more precise the detection, the more targeted the attack.
From a defender’s perspective, it is a visibility gap. Most organizations know what technologies they deploy centrally. They rarely know what is running on every subdomain, what software versions are embedded in published documents, or which outdated frameworks are still quietly serving traffic on forgotten staging environments.
The OWASP Top 10 ranks Security Misconfiguration as the fifth most critical web application security risk — and technology exposure is one of its most common manifestations. Default configurations that reveal server versions, unnecessary HTTP headers that advertise your stack, error pages that disclose framework details, and metadata in documents that reveals internal tooling — all of these fall under the security misconfiguration umbrella.
The connection between tech stack detection and attack surface mapping is direct: every technology you expose is an entry in the attacker’s playbook. Reduce the exposure, and you reduce the attack surface.
How Attackers Fingerprint Your Technology Stack
Technology fingerprinting is not a single technique — it is a collection of methods, each revealing different layers of your infrastructure. Understanding them is the first step toward shutting them down.
HTTP Response Headers
The most common — and most easily preventable — source of technology leakage. Every HTTP response from your server includes headers, and many default configurations include headers that explicitly advertise the software stack:
In this example, a single request reveals nginx version, Express.js backend, ASP.NET compatibility layer, and WordPress version. An attacker now has four specific technologies to research for known vulnerabilities — without sending a single malicious packet.
HTML Source Code and Meta Tags
CMS platforms and frontend frameworks leave signatures in the HTML source:
- WordPress injects
<meta name="generator" content="WordPress 6.4.2" />and loads resources from/wp-content/and/wp-includes/paths - Drupal uses
Drupal.settingsJavaScript objects and characteristic CSS file naming - Joomla references
/media/system/paths and includes generator meta tags - React, Angular, Vue leave characteristic
<div id="root">,<app-root>, or[data-v-]attribute patterns - Next.js creates
/_next/resource paths and__NEXT_DATA__script blocks - Tailwind CSS produces recognizable utility class patterns in the DOM
Even if you remove the generator meta tag, the structural patterns in your HTML often reveal the underlying framework to anyone who knows what to look for.
URL Patterns and File Structures
Different technologies create different URL structures. An attacker scanning your site can identify your stack from URLs alone:
Each of these patterns is a signal. Combined, they paint a detailed picture of the technology decisions your organization has made — and the specific vulnerabilities those decisions may have introduced.
Error Pages and Default Configurations
When something goes wrong, servers often reveal more than they should. A 404 page that displays “Apache Tomcat/9.0.65” or a 500 error that shows a Django debug traceback with Python version, installed packages, and settings module paths gives an attacker a detailed inventory of your backend.
Default configurations are particularly dangerous because they exist on systems that were deployed quickly and never hardened. A default Tomcat installation exposes the server version on every error page. A default Django deployment in debug mode shows the complete request context, installed middleware, and database configuration. A default Spring Boot Actuator exposes health checks, environment variables, and configuration properties.
JavaScript Libraries and Client-Side Dependencies
Modern web applications load dozens of JavaScript libraries, and each one is visible in the browser’s network tab or the page source. Libraries like jQuery, Lodash, Moment.js, and specific framework versions can be identified from:
- Script
srcpaths containing version numbers (/jquery-3.6.0.min.js) - Global JavaScript objects (
window.jQuery.fn.jqueryreturns the version) - Source map files (
.mapfiles) that often contain the full unminified source package.jsonorpackage-lock.jsonfiles accidentally deployed to production
An outdated JavaScript library with a known XSS vulnerability — like certain versions of jQuery or Angular.js — is an immediate, exploitable finding.
Subdomain Infrastructure Analysis
Your main domain might be well-hardened, but what about staging.example.com, jenkins.example.com, grafana.example.com, or legacy-app.example.com? Each subdomain is its own attack surface with its own technology stack, often managed by different teams and held to different security standards.
Subdomain enumeration combined with technology fingerprinting frequently reveals:
- Development and staging environments running debug configurations
- Admin panels for databases, monitoring tools, or CI/CD pipelines
- Legacy applications running end-of-life software with unpatched vulnerabilities
- Third-party services configured under your domain (helpdesks, marketing tools, analytics platforms)
The most dangerous findings are often on subdomains that nobody remembers deploying. A forgotten staging server running a two-year-old version of a CMS, still connected to a real database, is one of the most common entry points in real-world breaches.
Beyond Subdomains: Technology Exposure in Files and Documents
Tech stack detection does not stop at live web infrastructure. Some of the most revealing technology indicators hide inside the files your organization publishes — PDFs, Word documents, presentations, spreadsheets, and images that are freely downloadable from your domain.
How File Metadata Leaks Your Technology Stack
Every file carries metadata — invisible information embedded by the software that created it. This metadata can reveal the author’s identity, the exact software and version used to create the document, the operating system it was created on, internal file paths, and even project names that were never meant to be public.
Consider what an attacker learns from a single PDF — the employee who wrote it, the software they used, their operating system, and their internal file organization. This is not theoretical — it is extractable with a single command:
From one public document, an attacker now knows a real employee name, that the organization uses Microsoft Word 2019 on macOS Sonoma, and that the document concerns an internal quarterly financial review. Combined with email discovery and breach database checks, this metadata becomes the building block for a highly targeted attack.
Connecting Files to People: The Compound Risk
File metadata becomes exponentially more dangerous when correlated with people profiles. When Cyborux discovers documents on your domain and extracts their metadata, it does not just list the files — it connects them to the people who created them.
This means you can see:
- Which employees are creating documents with exposed metadata
- What software and operating systems each person uses
- Which internal projects appear in file paths
- How many documents each person has published externally with sensitive metadata
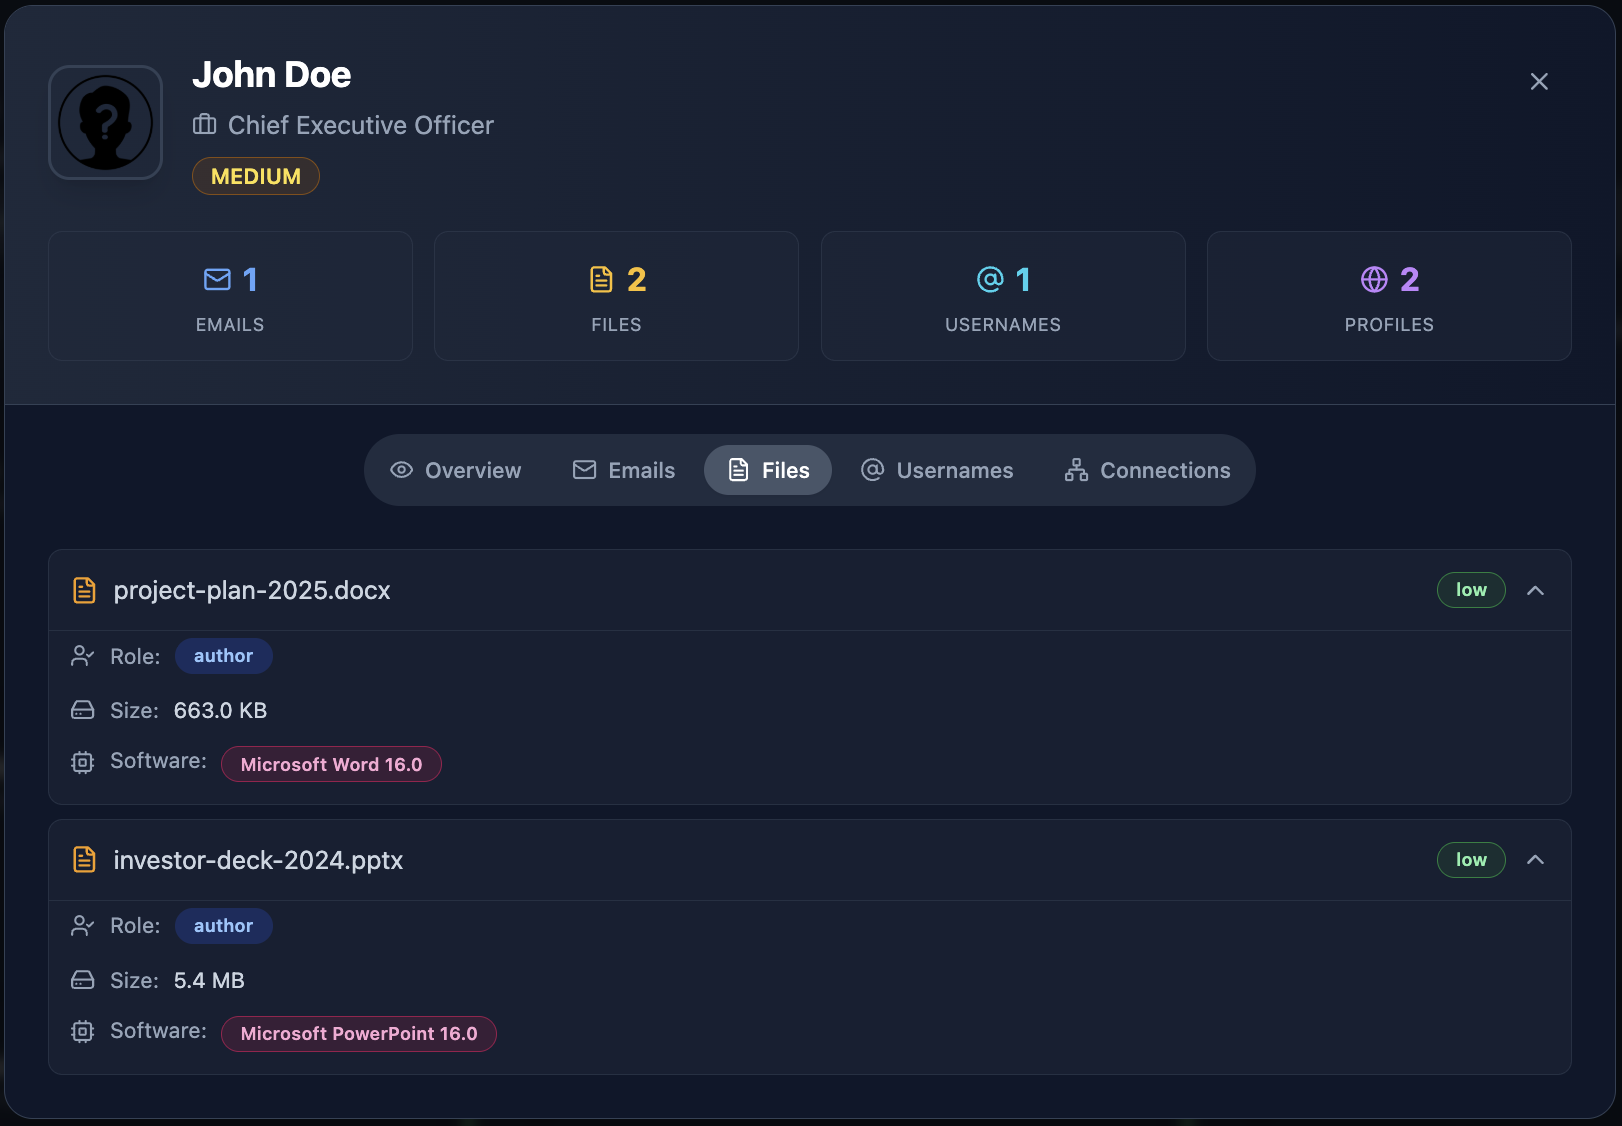
An attacker who finds a PDF authored by your CTO using an outdated version of Adobe Acrobat — a version with known CVEs — now has a high-value target and a specific exploit vector. They can send a crafted PDF to the CTO’s email (which they found through email enumeration), exploiting the exact Acrobat version revealed in the metadata.
This is how tech stack detection and employee exposure overlap. The technology information in files tells the attacker what to exploit. The people information tells them who to target. Together, they form the blueprint for a precision attack.
The People Factor: Who Uses What and Why It Matters
Technology exposure is not just about servers and files. It is about people — and the technologies they reveal through their public digital presence.
LinkedIn as a Technology Inventory
Job titles and skill endorsements on LinkedIn create a surprisingly accurate map of an organization’s technology stack. When three developers at a company list “Kubernetes,” “Terraform,” and “AWS EKS” in their profiles, an attacker infers the cloud infrastructure. When the data engineering team lists “Apache Kafka” and “Snowflake,” the data pipeline becomes visible.
LinkedIn job postings are even more revealing. A listing for “Senior DevOps Engineer — experience with Jenkins, ArgoCD, and Helm required” tells an attacker exactly which CI/CD and deployment tools the organization uses. An attacker does not need to scan a single port — the HR department published the technology inventory publicly.
GitHub Contributions and Code Repositories
Developers who contribute to open-source projects or maintain public repositories often inadvertently reveal internal technology choices. Commit messages referencing internal systems, configuration files with service names, and package.json or requirements.txt files listing exact dependency versions — all publicly visible on GitHub.
A developer’s public Dockerfile that installs a specific version of PostgreSQL, Redis, and a Python framework is a direct window into the production stack. Even without access to private repositories, the public contributions of employees paint a detailed picture.
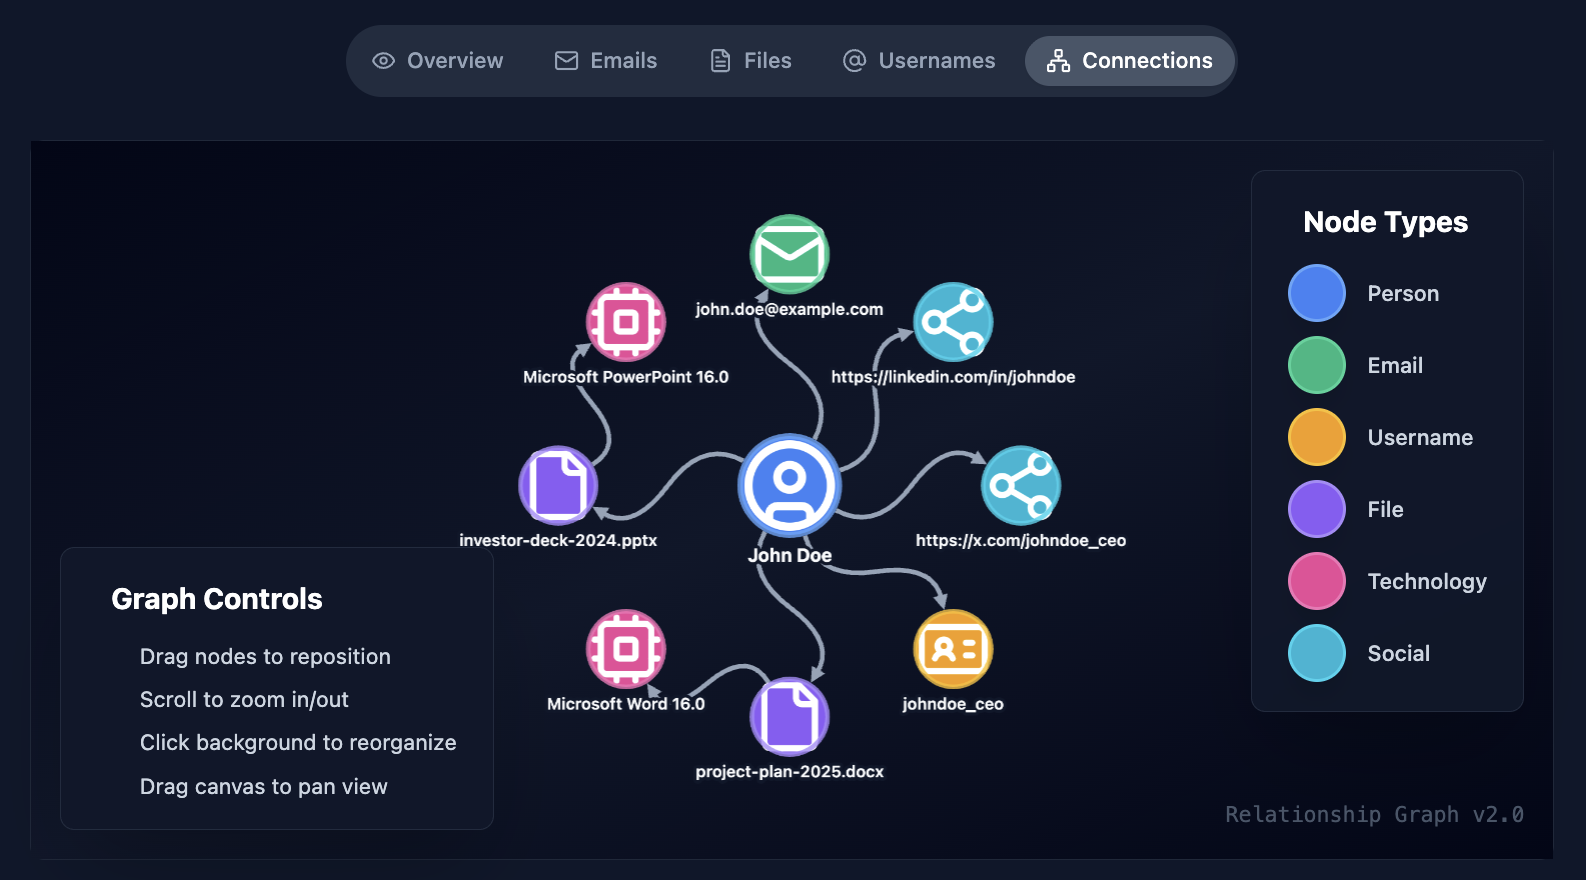
Cross-Referencing People and Technologies
The real power of people-based tech stack detection comes from correlation. When you combine:
- LinkedIn profiles revealing skills and tech stacks
- GitHub activity revealing frameworks and dependencies
- Published documents revealing software versions
- Subdomain analysis revealing deployed technologies
You get a technology map that is tied to specific people. This is exactly what Cyborux does — it connects discovered technologies to the people and infrastructure where they were found, showing not just what technologies are exposed, but who is exposing them and where.
From Detection to Exploitation: The Risk Chain
Knowing your tech stack is not the end goal for an attacker — it is the beginning. Here is how technology detection feeds directly into exploitation.
The OWASP Security Misconfiguration Problem
OWASP A05:2021 — Security Misconfiguration is defined as a broad category that includes:
- Missing security hardening across the application stack
- Unnecessary features enabled (debug pages, unused ports, default accounts)
- Default credentials unchanged
- Error handling that reveals stack traces or technical details
- Missing or misconfigured security headers
- Software that is out of date or vulnerable
Tech stack detection is the attacker’s entry point into security misconfiguration. When an attacker knows your exact software versions, they can check whether those versions have known misconfigurations or vulnerabilities — turning an information disclosure finding into an exploitation pathway.
CVE Databases and Known Vulnerabilities
Every major software product has a history of disclosed vulnerabilities tracked in the National Vulnerability Database (NVD). When tech stack detection reveals that your login subdomain runs Keycloak 22.0.1, a single search shows whether that version has known CVEs — and the details of each vulnerability, including severity, attack vector, and whether a public exploit exists.
The issue is not that vulnerabilities exist. Every software has them. The issue is that exposed version information tells attackers exactly which vulnerabilities apply to you, eliminating the guesswork from their attack and making automated exploitation trivial.
Understanding EPSS Scores: Which Vulnerabilities Get Exploited
Not all vulnerabilities are equal. A CVE with a critical CVSS score may never be exploited in the wild, while a medium-severity vulnerability in a popular CMS might be mass-exploited within days of disclosure. This is where the Exploit Prediction Scoring System (EPSS) becomes critical.
EPSS, developed by FIRST, is a data-driven model that estimates the probability that a specific vulnerability will be exploited in the wild within the next 30 days. Unlike CVSS (which measures theoretical severity), EPSS measures real-world exploitation likelihood based on factors including:
- Active exploitation data from threat intelligence feeds
- Characteristics of the vulnerability (attack vector, complexity, privileges required)
- Age of the vulnerability and availability of public exploits
- Software popularity and deployment prevalence
To see why this distinction matters, consider two vulnerabilities discovered on the same server after tech stack detection:
The practical implication is clear: when tech stack detection reveals a specific software version, smart attackers do not just look for the highest CVSS — they look for the highest EPSS score. A medium-severity vulnerability with a 95% EPSS score is far more dangerous than a critical-severity one with a 0.5% EPSS score, because the first one has active exploits circulating in the wild.
For defenders, this means prioritization. Not every exposed software version is equally urgent to patch or hide. Focus first on technologies where the detected version has vulnerabilities with high EPSS scores — those are the ones being actively exploited right now.
The Exploitation Timeline
Here is how the chain works in practice:
  ┌─────────────────────────────────────────────────────────────┐
  │  TECH STACK DETECTION → EXPLOITATION CHAIN                  │
  ├─────────────────────────────────────────────────────────────┤
  │                                                             │
  │  1. RECONNAISSANCE                                          │
  │     │  Scan subdomains, headers, files, source code         │
  │     │  Identify: nginx 1.22 · WordPress 6.4.2 · PHP 8.1     │
  │     ▼                                                       │
  │  2. VULNERABILITY MAPPING                                   │
  │     │  Cross-reference versions against CVE databases       │
  │     │  Filter by EPSS score > 0.5 (likely exploited)        │
  │     ▼                                                       │
  │  3. EXPLOIT SELECTION                                       │
  │     │  Find public exploit for WordPress plugin CVE         │
  │     │  EPSS: 0.89 — actively exploited in the wild          │
  │     ▼                                                       │
  │  4. TARGETED ATTACK                                         │
  │     │  Deploy exploit against specific subdomain            │
  │     │  Or craft phishing payload for detected software      │
  │     ▼                                                       │
  │  5. INITIAL ACCESS                                          │
  │     │  Foothold on web server or employee workstation       │
  │     │  Lateral movement using discovered infrastructure     │
  │     ▼                                                       │
  │  6. IMPACT                                                  │
  │        Data breach · Ransomware · Supply chain compromise   │
  │                                                             │
  └─────────────────────────────────────────────────────────────┘
The critical insight is that step 1 — tech stack detection — makes every subsequent step faster, cheaper, and more likely to succeed. Without version information, an attacker must try exploits blindly or invest in more expensive reconnaissance. With version information freely available, exploitation becomes a lookup exercise.
Attack Surface Mapping: How Tech Stack Detection Fits the Bigger Picture
Attack surface mapping is the process of identifying all the entry points through which an attacker could potentially interact with your systems. It includes IP addresses, domains, subdomains, open ports, web applications, APIs, cloud services, and — critically — the technologies running on each of them.
Tech stack detection is a central component of attack surface analysis because it transforms a list of assets into a list of actionable vulnerabilities. Knowing that you have 47 subdomains is useful. Knowing that three of those subdomains run outdated WordPress installations with high-EPSS vulnerabilities is actionable.
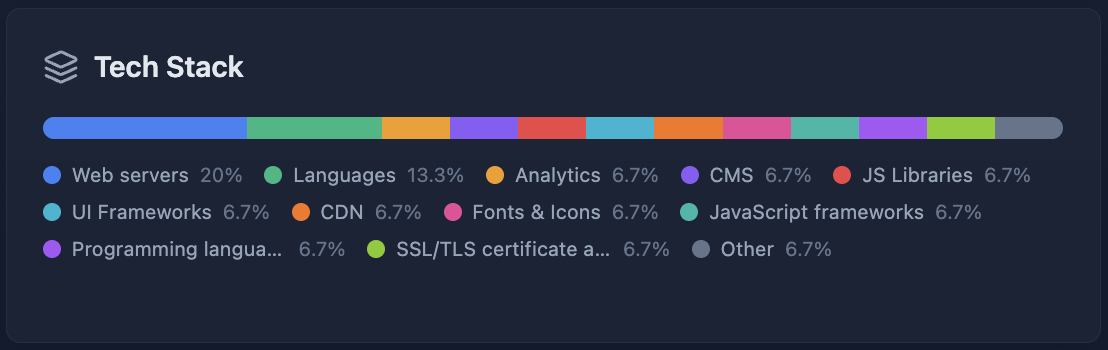
The Three Layers of Technology Exposure
Think of your technology exposure as three interconnected layers:
Layer 1: Infrastructure — Web servers, operating systems, load balancers, CDNs, DNS configurations. These are detected through HTTP headers, DNS records, and certificate transparency logs. They define the foundation of your attack surface.
Layer 2: Application — CMS platforms, frameworks, APIs, authentication systems, admin panels. These are detected through URL patterns, HTML signatures, error pages, and response behaviors. They contain the most exploitable vulnerabilities because they handle user input and business logic.
Layer 3: Content — Published documents, code repositories, metadata in images, configuration files left accessible. These are detected through Google dorking, file enumeration, and metadata extraction. They leak information about internal systems, employee details, and technology choices that were never meant to be public.
Each layer feeds the others. Infrastructure detection reveals where applications run. Application detection reveals what content they serve. Content analysis reveals details about internal infrastructure. Together, they form the complete external attack surface that an attacker maps during reconnaissance.
Continuous Attack Surface Management
The technology landscape is not static. New subdomains are created. Applications are updated — or not updated. Documents are published, removed, and republished. Third-party services are integrated and forgotten. Shadow IT introduces unauthorized tools.
This is why continuous attack surface management is essential. A one-time scan reveals the current state, but the attack surface changes daily. A subdomain that was secure last month may be running an outdated service today because someone deployed a test environment and forgot about it.
Effective attack surface management combines continuous asset discovery with technology fingerprinting — not just “what do we have exposed?” but “what is running on what we have exposed, and is it vulnerable?”
See what technologies you are exposing
Cyborux scans your subdomains, discovers published files, extracts metadata, and maps your technology exposure — all from a single domain. No agents to install, no scripts to maintain. Results in minutes.
Map Your Attack SurfaceHow to Detect Your Own Technology Exposure
Before you can fix technology exposure, you need to see it. Here is a practical framework for discovering what your organization is leaking.
Step 1: Scan Your HTTP Headers
Start with the simplest check. For every domain and subdomain you control, inspect the HTTP response headers:
Look for any header that reveals a specific software name or version number. Common offenders include Server, X-Powered-By, X-Generator, X-AspNet-Version, and X-Drupal-Cache.
Step 2: Audit Error Pages and Default Endpoints
Deliberately trigger error conditions on your applications and observe the response. Request non-existent URLs, submit malformed input, and check common default paths (/server-info, /server-status, /actuator, /health, /debug). If any of these reveal technology details, framework versions, or stack traces — it needs to be fixed.
Step 3: Extract and Analyze File Metadata
Collect all publicly downloadable documents from your domains — PDFs, DOCX, XLSX, PPTX files. Extract their metadata and catalog what is being exposed:
Pay special attention to Creator, Producer, Application, and Software fields — these directly reveal the tools and versions used to create each document.
Step 4: Review Subdomain Technologies
Subdomain enumeration combined with technology scanning is essential. Many organizations harden their primary domain but leave subdomains running outdated software, exposed admin panels, or debug configurations.
For each discovered subdomain, check:
- Is the technology stack up to date?
- Are there exposed admin panels or debug endpoints?
- Is the subdomain still needed, or is it a forgotten deployment?
- Does it expose different (potentially less secure) technologies than the main site?
Step 5: Automate With Cyborux
Running these checks manually across dozens or hundreds of subdomains, scanning for documents with metadata, and correlating technology findings with employee data is time-consuming and error-prone when done by hand.
Cyborux performs this entire workflow automatically. Enter a domain and the platform discovers subdomains, identifies technologies, finds published documents, extracts metadata, and connects everything to the people and infrastructure where it was found. What would take hours of manual scanning and correlation happens in minutes — with results organized into actionable findings rather than raw data dumps.
Best Practices for Reducing Technology Stack Exposure
Discovery is the first step. Here is how to systematically reduce the technology exposure that feeds attack surface mapping and exploitation.
Harden HTTP Response Headers
Remove or obscure technology-revealing headers from all production servers:
- Remove
Serverheader or set it to a generic value. In nginx:server_tokens off;. In Apache:ServerTokens ProdandServerSignature Off. - Remove
X-Powered-By— Express.js:app.disable('x-powered-by'). PHP: setexpose_php = Offin php.ini. - Remove CMS generator tags — WordPress: add
remove_action('wp_head', 'wp_generator');to your theme’s functions.php. - Add security headers — Replace information-leaking headers with security-enhancing ones:
X-Content-Type-Options,X-Frame-Options,Content-Security-Policy,Strict-Transport-Security.
Strip Metadata From Published Documents
Implement metadata stripping as a standard part of your document publishing workflow:
- Before publishing any document, run it through a metadata removal tool (ExifTool, mat2, or built-in “Remove Properties” in Microsoft Office)
- Automate stripping in CI/CD if documents are published through automated pipelines
- Establish a policy requiring metadata removal before any document is uploaded to the corporate website
- Audit existing documents already published on your domain — the metadata is already exposed and needs to be addressed retroactively
Remove Default Pages and Debug Endpoints
Audit every application for default content that should not be in production:
- Remove default installation pages, README files, and CHANGELOG files from web roots
- Disable debug modes, stack traces, and verbose error reporting in production
- Remove or restrict access to admin panels, phpMyAdmin, Swagger UI, GraphQL playground, and Spring Boot Actuator endpoints
- Disable directory listing on all web servers
Keep Software Updated and Minimize Exposure Window
When tech stack detection reveals a specific version, the attacker’s next step is checking for known vulnerabilities. Keeping software current reduces the window of opportunity:
- Patch critical and high-EPSS vulnerabilities immediately — these are the ones being actively exploited
- Maintain an accurate software inventory so you know what versions are deployed and where
- Remove end-of-life software that no longer receives security updates
- Monitor for new CVEs affecting your detected technology stack
Eliminate Unnecessary Technology Exposure
Apply the principle of least information:
- Do not expose technologies that do not need to be public-facing (move admin panels behind VPNs, restrict API documentation to authenticated users)
- Remove source map files from production deployments
- Clean up forgotten subdomains and decommission unused services
- Review job postings and public documents for unnecessary technology references
Implement Continuous Monitoring
Technology exposure changes constantly. A one-time audit becomes outdated quickly. Implement continuous attack surface management that regularly:
- Scans for new subdomains and exposed services
- Checks deployed software versions against vulnerability databases
- Monitors for newly published documents with embedded metadata
- Alerts when new technology is exposed on your infrastructure
This is where platforms like Cyborux provide the most value — continuous monitoring that catches new exposures as they appear, not months later during the next manual audit.
Frequently Asked Questions
What is tech stack detection?
Tech stack detection (also called technology fingerprinting) is the process of identifying the software, frameworks, libraries, and specific versions running on a web application or infrastructure. Attackers use tech stack detection as the first step in targeted exploitation — knowing that a target runs a specific version of WordPress, nginx, or Keycloak allows them to search for and exploit known vulnerabilities in those exact versions. Defensively, organizations use tech stack detection to identify exposed technologies before attackers do and to harden or update them.
How does security misconfiguration relate to tech stack detection?
Security misconfiguration (OWASP A05:2021) includes any configuration that unnecessarily reveals information about your technology stack. HTTP headers that advertise software versions, error pages that show stack traces, default admin panels left accessible, and metadata in published documents are all security misconfigurations that enable tech stack detection. Fixing these misconfigurations is often the most effective way to reduce technology exposure without changing the underlying technology.
What is an EPSS score and why does it matter?
The Exploit Prediction Scoring System (EPSS) estimates the probability that a vulnerability will be exploited in the wild within the next 30 days. Unlike CVSS (which measures theoretical severity), EPSS measures real-world exploitation likelihood. When tech stack detection reveals a specific software version, checking the EPSS scores of its known vulnerabilities tells you which ones are actually being exploited right now — enabling better patch prioritization. A medium-severity CVE with a 90% EPSS score is more urgent than a critical CVE with a 1% EPSS score.
Can attackers detect my technology stack if I remove version numbers?
Removing version numbers from HTTP headers and generator tags significantly reduces casual fingerprinting but does not eliminate it entirely. Advanced fingerprinting techniques use behavioral analysis — response timing, specific error message patterns, header ordering, cookie naming conventions, and subtle differences in protocol implementation — to identify technologies even without explicit version strings. However, removing explicit version information raises the difficulty substantially and eliminates the most common automated scanning techniques. Defense in depth means combining version hiding with other measures like regular patching and access restrictions.
How do published files expose our technology stack?
Documents published on your domain — PDFs, Word files, spreadsheets, presentations — contain embedded metadata that reveals the software used to create them, including exact version numbers. A PDF might reveal “Adobe Acrobat Pro DC 23.003” and the author’s internal file path on a Windows 10 machine. This tells an attacker what software specific employees use, which versions they run, and their operating system — information that can be used to craft targeted exploits (like a malicious PDF designed for a specific Acrobat vulnerability) or highly personalized phishing attacks.
What is attack surface mapping and how does it relate to tech stack detection?
Attack surface mapping is the comprehensive process of identifying all entry points through which an attacker can interact with your systems — including domains, subdomains, IP addresses, ports, applications, APIs, and cloud services. Tech stack detection is a critical component of attack surface mapping because it adds vulnerability context to each discovered asset. Without tech stack information, an attack surface map is a list of addresses. With it, the map becomes a prioritized list of potential exploitation paths, ranked by the severity and exploitability of the technologies running on each asset.
How does Cyborux help with tech stack detection?
Cyborux automates the complete technology exposure assessment workflow. Enter your domain and the platform discovers subdomains, identifies technologies running on each, finds published documents and extracts their metadata, discovers employee emails, and connects all findings to the people and infrastructure where they were found. This gives you the same visibility an attacker would build during reconnaissance — except you see it first and can act on it. No tools to install, no scripts to configure, and results are available in minutes rather than hours of manual scanning.
How often should we scan for technology exposure?
Continuously. Technology exposure changes every time a new subdomain is created, a new document is published, a software update is deployed (or missed), or a developer spins up a staging environment. At minimum, perform a full technology exposure audit quarterly and complement it with continuous monitoring that alerts you to new findings between audits. The gap between a new exposure appearing and an attacker discovering it can be days — not months.
Conclusion
Tech stack detection is not a niche concern for penetration testers — it is the first move in nearly every targeted attack. When your HTTP headers broadcast your server version, when your subdomains reveal outdated CMS installations, when your published documents carry metadata showing internal software and employee details, and when your job postings list your entire infrastructure stack — you are not just exposing technology. You are providing a roadmap.
The connection between security misconfiguration and exploitation is direct and measurable. Every exposed version number is a CVE lookup away from a known vulnerability. Every high EPSS score on a detected technology means someone is actively exploiting that exact weakness in the wild right now. Every piece of file metadata that reveals an employee’s software version is ammunition for a targeted attack.
The defense is not complicated. Strip your headers. Clean your metadata. Harden your configurations. Decommission what you do not need. And most importantly — know what you are exposing before someone else discovers it.
Cyborux gives you that visibility. Enter your domain and see your complete technology exposure — subdomains, files, metadata, people, and the connections between them. No installations, no configurations, no manual scanning across dozens of tools. Just the view that an attacker builds during reconnaissance, delivered in minutes so you can act on it before they do.
Your attackers are already fingerprinting your technology stack. The only question is whether you are doing it first.